

Beachman's investing plan - Welcome to the casino!
Beachman's investing plan - Welcome to the casino!
Portfolio: What I am planning to do in the markets and with my portfolio

Every so often, the market decides to prove all of us wrong...keeps us guessing. I was expecting more volatility last week, but that did not happen. So I went searching for answers and I found some clues.
Note that I said clues and not answers.
Today’s markets feel like a casino. Everyone walks in wanting to win, of course. Most investors do. Most traders don’t. We often read about others winning - CNBC stories about growing $10,000 into $1M in a year, Druck’s latest 13-F filing and fintwit posting their portfolio results every week to rack up followers. So we are tempted to double down and impatiently bet more. We want to make money like they apparently are…
Meanwhile, the house is always winning behind the curtain. The stock exchanges, the investment bankers, the trading houses, the market makers…they continue to rake in more and more in commissions and fees. Just recently, Citadel reported earning $4.9B +81% yoy in the first six months of 2024.

Table of contents
Market signals
Key questions
Beachman’s plan
Conclusion
Upcoming exclusive paid content
Beachman recommends
Each week, I will share my recommendation for an app, a book, a website, a podcast, a publication, a movie…anything that I found interesting and useful from an investing and financial management perspective. I don’t get paid to do this. Beachman’s Newsletter has and always will be an ad-free publication. So here goes…
Stockanalysis.com
This is my go to website for stock research and analysis.
I have tried many financial research websites and nothing touches Stock Analysis. Their site has a clean, uncluttered and easy-to-use interface. They publish about 99% of the metrics that I need for my analysis, including earning report financials, forward revenue forecasts, analysts ratings, institutional ownership and more. Their stock screener is one of the best I have ever used - a broad variety of screening metrics that can be further numerically refined to find exactly what you need.
I use their free service. I have not found the need to use their paid tier, although I am sure it could be useful to some investors and traders.
Stock Analysis has made my investing life much, much easier.
Market signals
Tug of war
About $5.3T in options positions expired last week. When these options expire, traders have to decide whether to close them out or roll them over into the following week, the next month or quarter etc. Market makers in turn have to close out their hedges. They either have to buy or sell the underlying stocks to do so causing higher market volatility.

If you look at the right side of the chart above, you will see a dramatic drop off in bullish CALL options (blue line) with future expirations. Traders decided to close out their bullish positions and cash out. Many of them de-leveraged and “went home”. Perhaps taking profits and pondering their next move in this frothy market.
Market makers had to sell stock (in their hedges) as these CALL options positions were closed out. This is why you see a very large red volume bar on the SP500 chart below. You will note similar over-sized red volume bars for triple witching in March and June.
To dig further, I looked at CBOE Put to Call ratios for last few days. The PC index for stocks dropped -31% into Fri, while the PC index for the SP500 rose +20%. Traders were bidding up individual stocks while expecting broader markets to drop in the near future.
One final data point…last week there was a significant drop in advancing versus declining stocks. On Fri, for example, 65% of equities declined versus 31% advancing.
Now, putting all of this together…things started making sense:
Markets continue to be bullish on certain individual stocks, especially the mega cap stocks that have a larger weight in the major indexes.
Participants are expecting markets to drop in the near future.
We did not get the downside volatility I was expecting because of #1 above.
The three dynamics above allowed the SP 500 and the Nasdaq to peep higher but there was a bull-bear tug of war causing them to close relatively flat on Thu and Fri.
Bottomline, the picture is quite murky under the surface. There are bulls out there and there are bears. Folks are placing their bets according to how they are reading markets.
It remains to be seen what happens.
SP500
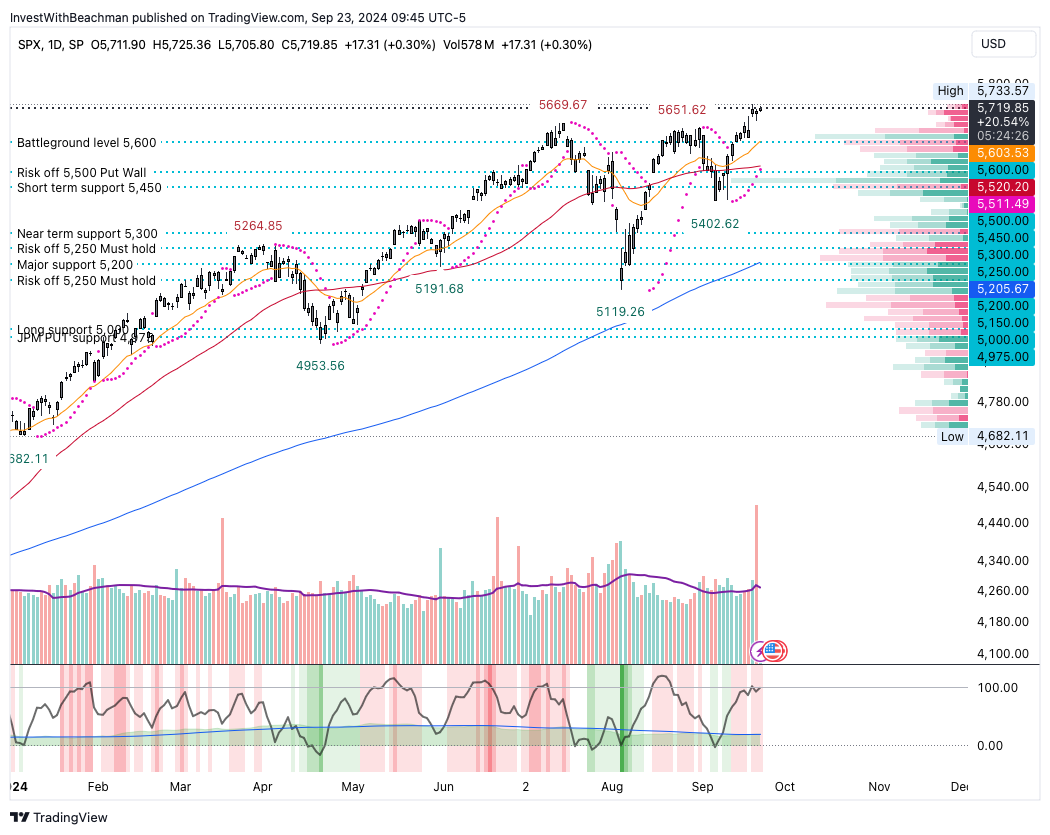
The 5,600 to 5,700 range remains the fat line in the sand for markets. It will either prove to be good support for a climb higher or it could be an upper ceiling if we go lower on a volatile drop.
Looking at the chart, we seem to be setting up for a triple-top, a bearish reversal pattern that forms after an extended uptrend. It could be signifying a potential shift in market sentiment from bullish to bearish.
On the other hand, I have heard seasoned traders say that there is no such thing as a triple top.
What is clear to me is that the market is overbought and running on fumes, while it keeps making new, all-time highs. We saw the 39th such ATH for the year last week. The Dow Jones index did the same, crossing 42,000 points on Thu.
YTD, the SP500 is up almost +20%, the Dow has gained +12% and the Nasdaq has logged +20%.
Maybe the change in the interest rate regime (US Feds are now cutting rates not raising them) will upset the apple cart somehow.
Feds pivot from inflation to employment
In the movie, “The Lord of the Rings”, the eye of the dark lord, Sauron, kept shifting from one part of Middle Earth to another, constantly monitoring for threats (aka the good guys). In similar fashion, last week, the US Feds cut interest rates by 0.50% and declared that going forward they are pivoting towards ensuring a healthy employment market in the US, further implying that their fight against inflation is largely complete. They are expecting to cut rates more aggressively in 2025 and 2026 versus the previous more drawn out schedule that extended cuts through 2027.

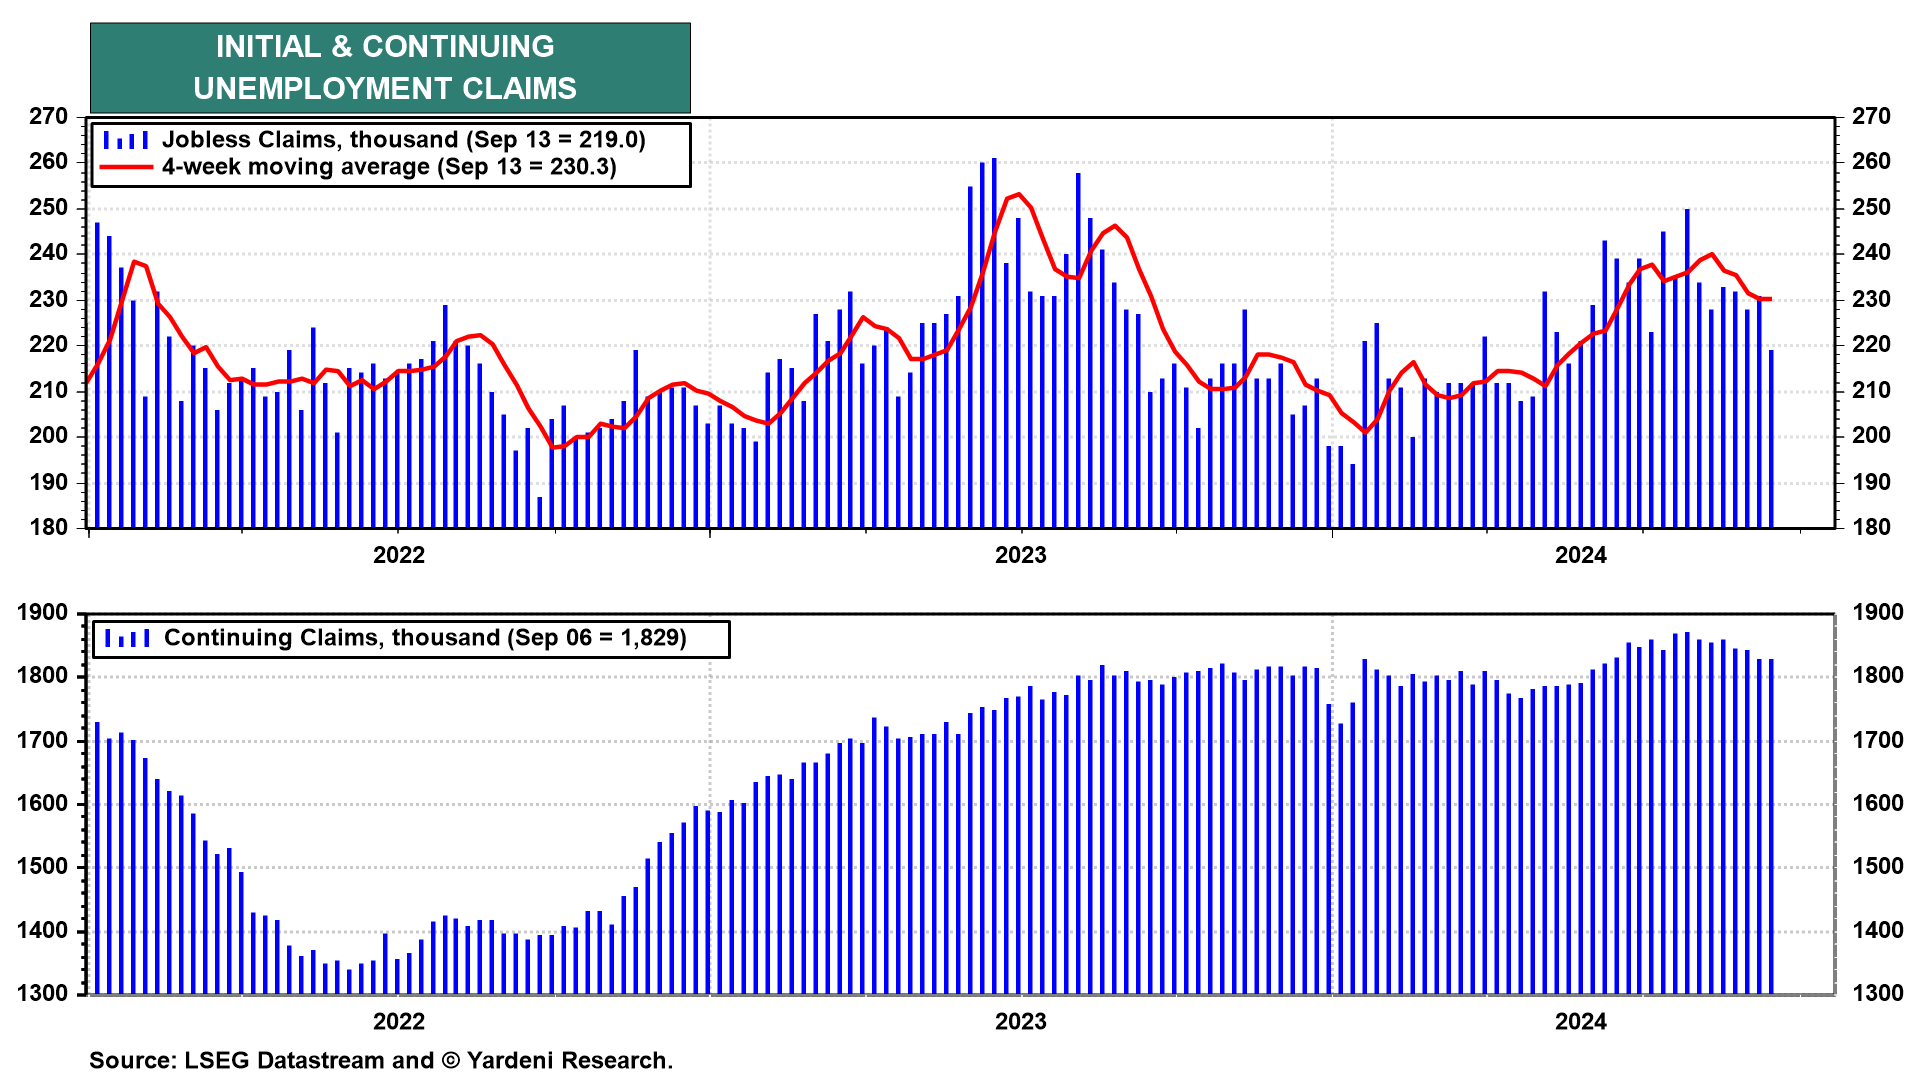
The updated dot plot suggests that they expect unemployment (currently at 4.2%) to rise to about 4.4% by end of 2024 and remain elevated in 2025.
Now, I found this chart by Yardeni quite interesting in the sense that jobless claims continue to trend lower, signaling a healthy jobs market that is getting better, not worse. So are the US Feds seeing something in the economic data that you and I don’t know about? Is that why we got a larger than expected 0.50% rate cut last week?
I am not one for Fed-bashing. I don’t think the US Feds are evil like Sauron. LOL.
They have a difficult job…managing the weight of the US economy on their shoulders while Congress spends freely based on political winds. In many ways, the Feds are the entire world’s central bank. The US economy is about $29T of the $110T global economy.
So they carry a lot of responsibility and I will not double-guess their intentions or actions.
I like the fact that this rate cut was not unanimous. I always like debate, discussion, differences of opinion prior to decision making. However, I wish they would give less speeches when they are not in their blackout period…too many of them are out there blabbing about monetary policy sowing confusion.
Now all eyes on the glide path to the much desired soft landing. I still think we can pull it off. US GDP growth is strong. The jobs market is healthy. The consumer is normalizing from the post-pandemic frenzy. Businesses of all stripes are doing well…some better than others, but few are hurting badly. Granted, there are some troubles to monitor - credit delinquencies, contracting manufacturing, drop in shipping and transportation business etc.
However, if we do get the soft landing, Powell could very well go down as one of the best Fed Chairs in the history of the US.
Shutdown risk
Every Sept, we find ourselves asking the question about whether the US government will shut down on Oct 1st because the clowns in Congress cannot get their act together and pass a budget.
This year is no different and we literally have days before the administration runs out of approved monies to pay salaries, run federal government operations, keep parks and services open etc.
Every year, Congress has to pass a bill to set spending levels for the upcoming fiscal year which starts on Oct 1. As of today, Congress appears to be at a standstill with their 2025 funding decision.
Being a presidential election year, you can bet that there will be more shenanigans at play…each side trying to score political points on the issue.
As investors, we need to keep an eye on this nonsense in case it gets out of hand and threatens the US economy.
Follow Beachman
On the daily, you can find Beachman in two places…
Beachman’s substack chat line here
Beachman’s Threads feed here
Please check out the must-reads listed on the About page and the Roadmap page. I have stopped using Twitter.
Key questions
The specific, top-of-mind questions that will shape where and how I invest for the rest of 2024 and leading into 2025:
Who is actually making money in AI now or in the near future?
When will the current AI capex boom turn lower?
Who will be the next beneficiary of hyperscaler and enterprise AI spend?
Are markets underestimating US geopolitical risk?
How will small cap stocks perform in response to interest rate cuts?
I, regularly, curate such research questions to stay hyper focused on finding the best investment opportunities for my portfolio.
I recently initiated 2 new positions in my portfolio - a small cap AI stock and a small cap ETF. Based on the Q2 earnings season, I now have 5 stocks on my active watchlist. I am highly interested in these stocks as possible additions to my portfolio and I identified preferred buy points for each of them.
The hunt continues…
Beachman’s plan
Given the market signals discussed above…
…given the key questions that I am researching…
…my simple, actionable, measurable investing plan is as follows: