


Preparing Beachman's portfolio for 2024: Part 1
Markets: Getting my portfolio in shape to handle multiple 2024 scenarios

Introduction
Every investing year has a certain character and I try to align with it by organizing my portfolio to maximize gains and minimize losses.
In 2021, I was almost fully invested most of the time, riding the bull wave higher. No hedging. It was not needed. I finished the year with a +68% return.
In 2022, the US Feds’ first interest rate hike in March made it clear that growth markets would struggle to perform. Therefore, I barbell-hedged my portfolio with a balance of growth and value holdings to minimize the beta and lower the volatility. I wrapped up the year with a -21% return.
This year, in 2023, I went back to a high beta, growth portfolio because it seemed that we were getting to the end of the rate hike regime. Markets are forward thinking by about 9-12 months and there was no sense in waiting for the all-clear rate pause before putting money to work. So far so good with YTD returns of +53%.
Looking forward to 2024, we are likely going to deal with a different animal and I started whiteboarding my portfolio goals, structure, target allocations and a few hedging ideas that we will discuss in this series.
Let’s dig in…

2024 macro map
Before we talk about specific portfolio plans, we need to map out how 2024 is likely to play out in terms of broad macro. We are not in the business of guessing or predicting. However, we can make informed “guesstimates”.

Rates
I believe that the US Feds are done with rate hikes in this cycle. The recent stress in the bond markets is giving them cause to pause because it is having a strong tightening effect on markets as a whole (GS estimates this to be equivalent to rate hikes of 0.75%)…essentially doing the FOMC’s work for them. Now the question is when will we see the first rate cut? We might see rate cuts starting in mid-2024, almost certainly in H2 2024. The FOMC now has more than 5% of rate cuts ready to deploy as needed. However, rates are likely to stay higher for longer even through end 2024.
Labor and the consumer
While the recent Sept jobs report was a strong one, it is a lagging indicator and obscures underlying weakness in the labor market. In fact, full-time employment contracted by -692k jobs over the past 3 months. The last 3 times this happened was in 2001, 2008 and 2020…all recessions. As we enter 2024, we could see higher unemployment rates, which could continue for all of 2024…remember the lagging effect. This will put a damper on consumer sentiment leading to lower consumer discretionary spending and retail sales.
Inflation
I expect retail inflation to be range-bound between 3-4% which I also believe to be well within the tolerance levels of the US consumer. The US Feds might be inclined to cut rates before inflation reaches their 2% target. They are scared of “breaking the economy” by being to restrictive in their policy for too long. We might even get a subtle loosening of the FOMC away from that 2% goal. Think of inflation as a big ship. The captain starts the turn and applies the reverse thrusters early and slowly in order to gently dock the ship.
Economic growth
US growth could slow down in almost all sectors. Q3 2023 GDP jumped to +4.9%, after hovering in the very healthy 2% range for the previous four quarters. We have now had five consecutive quarters of growth and Q4 2023 is also expected to come in around +2%. The first half of 2024 is expected to be much slower followed by a better H2 2024. Looking at the chart below, some analysts argue that we have already had a recession with two quarters of negative growth last year. I happen to agree with them somewhat.

US$ and commodities
The US$ will start showing signs of topping in anticipation of future rate cuts. International funds will continue to flow into the US$ as a safe haven, especially given that rates will stay at peak levels for a while longer. i.e. When US bond rates are high, international money likes to buy those bonds due to their safe haven personality and the high yield return. They have to buy these bonds using US$ and therefore have to exchange their local currencies into US$, thus raising demand for US$ and keeping the US$ elevated.
Conversely, when the US$ is higher, international markets find it more expensive to buy commodities to fuel their internal economic growth. Therefore, they buy less commodities and prices of said commodities stay depressed. If US economic growth is low in 2024, there is lesser demand for commodities, thus keeping their prices depressed.
Earnings and markets
If US GDP slows down, then revenues for US companies will drop and subsequently earnings will slow down.
It is still an open question as to how US equity markets will perform. One would think that equities would fall given such terrible macro conditions. This could be true in the short term, however things could turn bullish pretty quickly because…
…markets are forward thinking by about 9-12 months.
Putting it all together, here is a chart, from Bloomberg, showing US economists’ expectations over the next 3 years.

To celebrate the 2-year anniversary of this publication, Beachman is offering a 10% lifetime discount on the annual paid subscription (28% lower than subscribing monthly). Use this link to take advantage of the limited time offer now: https://beachman.substack.com/sale28
Other scenarios
Now, let’s discuss some alternate scenarios that could play out in 2024. We need to consider these possibilities because each of them might need us to tweak our 2024 portfolio management approach to ensure that we…maximize our gains and minimize our losses.
Soft landing
The economy could pleasantly surprise us and experience a soft landing in 2024. We could see…
lower inflation + average growth + healthy employment + stable consumer
…followed by lower interest rates.
This could happen because:
The interest rate burden for businesses with strong balance sheets is not as high as current interest rates. They have long term debt locked in at low interest rates (similar to homeowners) and short term investments earning high interest rates. So their net debt burden is muted and the cost of capital is dampened.
Liquidity is not as tight as the US Feds would prefer. Bank based liquidity is lower (they are lending less), however private funding is higher.
Consumer credit burden is not as high as it was in past recessions. More than 90% of homeowners have either locked in a sub-4% mortgage rate or own their homes outright. Housing costs are usually the largest debt expense for the consumer and if this is at an affordable level, the consumer could continue to carry the economy through recessionary forces.
The consumer is more well off than we think. According to the Federal Reserve’s triennial Survey of Consumer Finances, net worth for the typical US household grew 37%, after inflation, from 2019 to 2022. This growth was the highest on record, fueled by higher home and stock prices, pandemic-era government stimulus, higher income, higher investment ownership and lower wealth gap. Important to note that the survey also reported that on the far end of the wealth spectrum, the poverty rate increased to over 12%.
The US government is estimated to spend $6.3T in 2023, about 24% of GDP. The proposed budget for fiscal year 2024 is $6.9T, an increase of about 9.5% and includes over $300B in new infrastructure, transportation and technology spending.
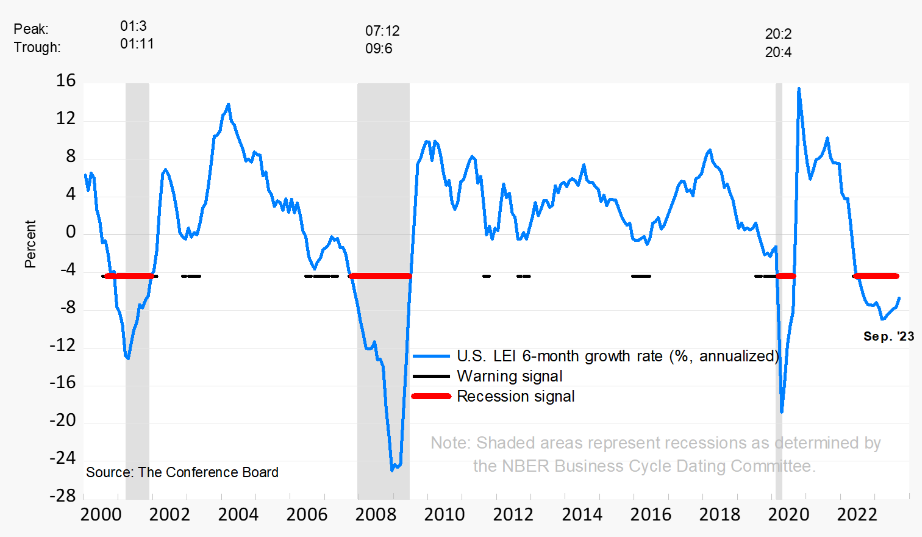
A hard landing has already occured in some sectors such as housing, manufacturing, energy and technology. Any recessionary forces could have been playing out in waves across a few sectors at a time and over a longer period of time. The US Leading Economic Indicators index (LEI) has been recording sequential negative readings for 18 months now and is well below the recession warning line. Yet the US economy recorded a +4.9% GDP reading in Q3 2023.
The misery of 2022 along with the ups and downs of 2023 may have been the worst of it with better days ahead.
Small stings
We could experience isolated issues in certain economic pockets. Markets might ignore these events because they are likely already priced into current expectations and valuations. I do not think that any of these, by themselves, would move the needle:
One more rate hike.
Unemployment rate rises, but stays below or closer to 4.25%.
Inflation stays above 2% but below 4%.
GDP stays positive but below average on a qoq basis.
US$ index stays elevated but below $110.
Oil prices stay high but below $100.
Flesh wounds
One or more of these happenings will likely change my thesis on 2024 and I will need to adjust my portfolio accordingly. I might also need to update my barbell hedging approach to counter any further negative effects:
2 or more rate hikes - This will put more growth and possibly even day-to-day operating pressure on small caps, medium caps, SMB businesses and consumer spending.
Unemployment rate rises above 4.25% - This could result in more than 1M people losing their jobs in the US. Looking at historical job creation data, it could take about a year to create jobs for all these newly unemployed…after the economy turns around.
Inflation rises above 4% - If inflation rises above 4%, it will cause the US Feds to go back to the drawing board and likely increase interest rates again. You could apply this 4% rule to any inflation index…CPI, core CPI, PPI, core PPI, PCE or even core PCE. If any of them are above the 4% level for several months, that would not be bullish for markets.
GDP drops below 0% - This will mean that business activity is contracting, resulting in lower sales, less earnings, job losses etc. likely resulting in lower stock prices. On the flip side, this will denote a recessionary slowdown that could encourage the US Feds to cut interest rates.
US$ rises above $110 - An elevated US$ index will likely mean that US interest rates are high, that investors are looking to invest more in US bonds to take advantage of these rates, that recessionary forces are taking hold, that there is a rush to safety and that equity markets are turning lower. It also means that commodity prices could drop and emerging markets could stay depressed.
Oil prices rise above $100 - Irrespective of what drives oil prices higher, they need to rise above $100 in order to have a meaningful negative economic impact on the US consumer and the US economy. We continue to see data that consumers moderate their gas usage when prices rise and vice versa. We also see a lower, long term consumption trend precipitated by more working-from-home and increasing EV adoption.
Stagflation
If several of the more serious scenarios above take hold of the US economy, we could face the dreaded “S” word in 2024. Stagflation is a condition where the economy experiences a triple whammy of negative growth (-ve GDP), higher prices (inflation) and less jobs (unemployment). The US Feds wants to avoid this situation at all costs. The last time it happened in the US was in the 1970s and according to the history books, it was not fun..
Beachman’s top 5 leading macro indicators
I have written in the past that I focus on forward-looking, leading indicators that will help me understand where the economy and markets are heading. Most of what is discussed in fin media and fin twit are lagging indicators e.g. inflation, unemployment rate, jobs created, GDP, sales, earnings etc.
The 5 leading macro indicators I am watching are:
NFIB index: SMBs still staying relatively strong. The latest Sept reading was 90.8. The pre-pandemic norm was 103+ and the peak was around year-end 2019 at 104+.
10 year bond interest rate: Currently at 4.7%. Denoting that rates could stay higher for a bit longer and that inflation could linger above the US Feds’ 2% target.
US$ DXY index: Put in a 2023 low on July 13th and has risen over 6.8% since then. The chart made a golden cross on Sept 8th denoting that it could keep climbing higher.
ISM manufacturing & new orders: Oct ISM manufacturing was just reported today and it logged a disappointing 46.7, which was lower than the previous month and ended a brief 3 months of sequential rises. Even new orders dropped to 45.5 from a recent Sept high. So we will continue to look for a turnaround in manufacturing. That said, it denotes lower consumer demand aka lower inflation. It might also be reflecting the negative effects of the US auto workers strike.
ISM services & new orders: The Oct report comes out on Fri this week. Sept ISM services clocked in at 53.6 versus 54.5 in Aug. New orders fell -10% versus Aug. I would not be surprised with a lower Oct reading for similar reasons as the manufacturing index.
Let me know if there are other macro indicators that I should consider adding to this forward-looking list.
As we proceed in this series, we will next take a closer look at specific sectors and themes as well as how they might perform in 2024. We will review my current portfolio and 2024 goals. We will then consider how I might want to structure my 2024 portfolio, target allocations and holdings (current and new). That will be followed by a discussion on how I plan to hedge my portfolio next year. Finally, we will identify an action plan to counter the alternate scenarios listed above.
Cheers!
Please add to weekly chat. A link to article about TLT , how the yield of 20+ year bonds bought to replace the sale of shorter maturity bonds affects the TLT return.
https://seekingalpha.com/article/4647767-tlt-long-dated-us-treasuries-are-a-generational-buy?mailingid=33261949&messageid=etf_daily&serial=33261949.31610